
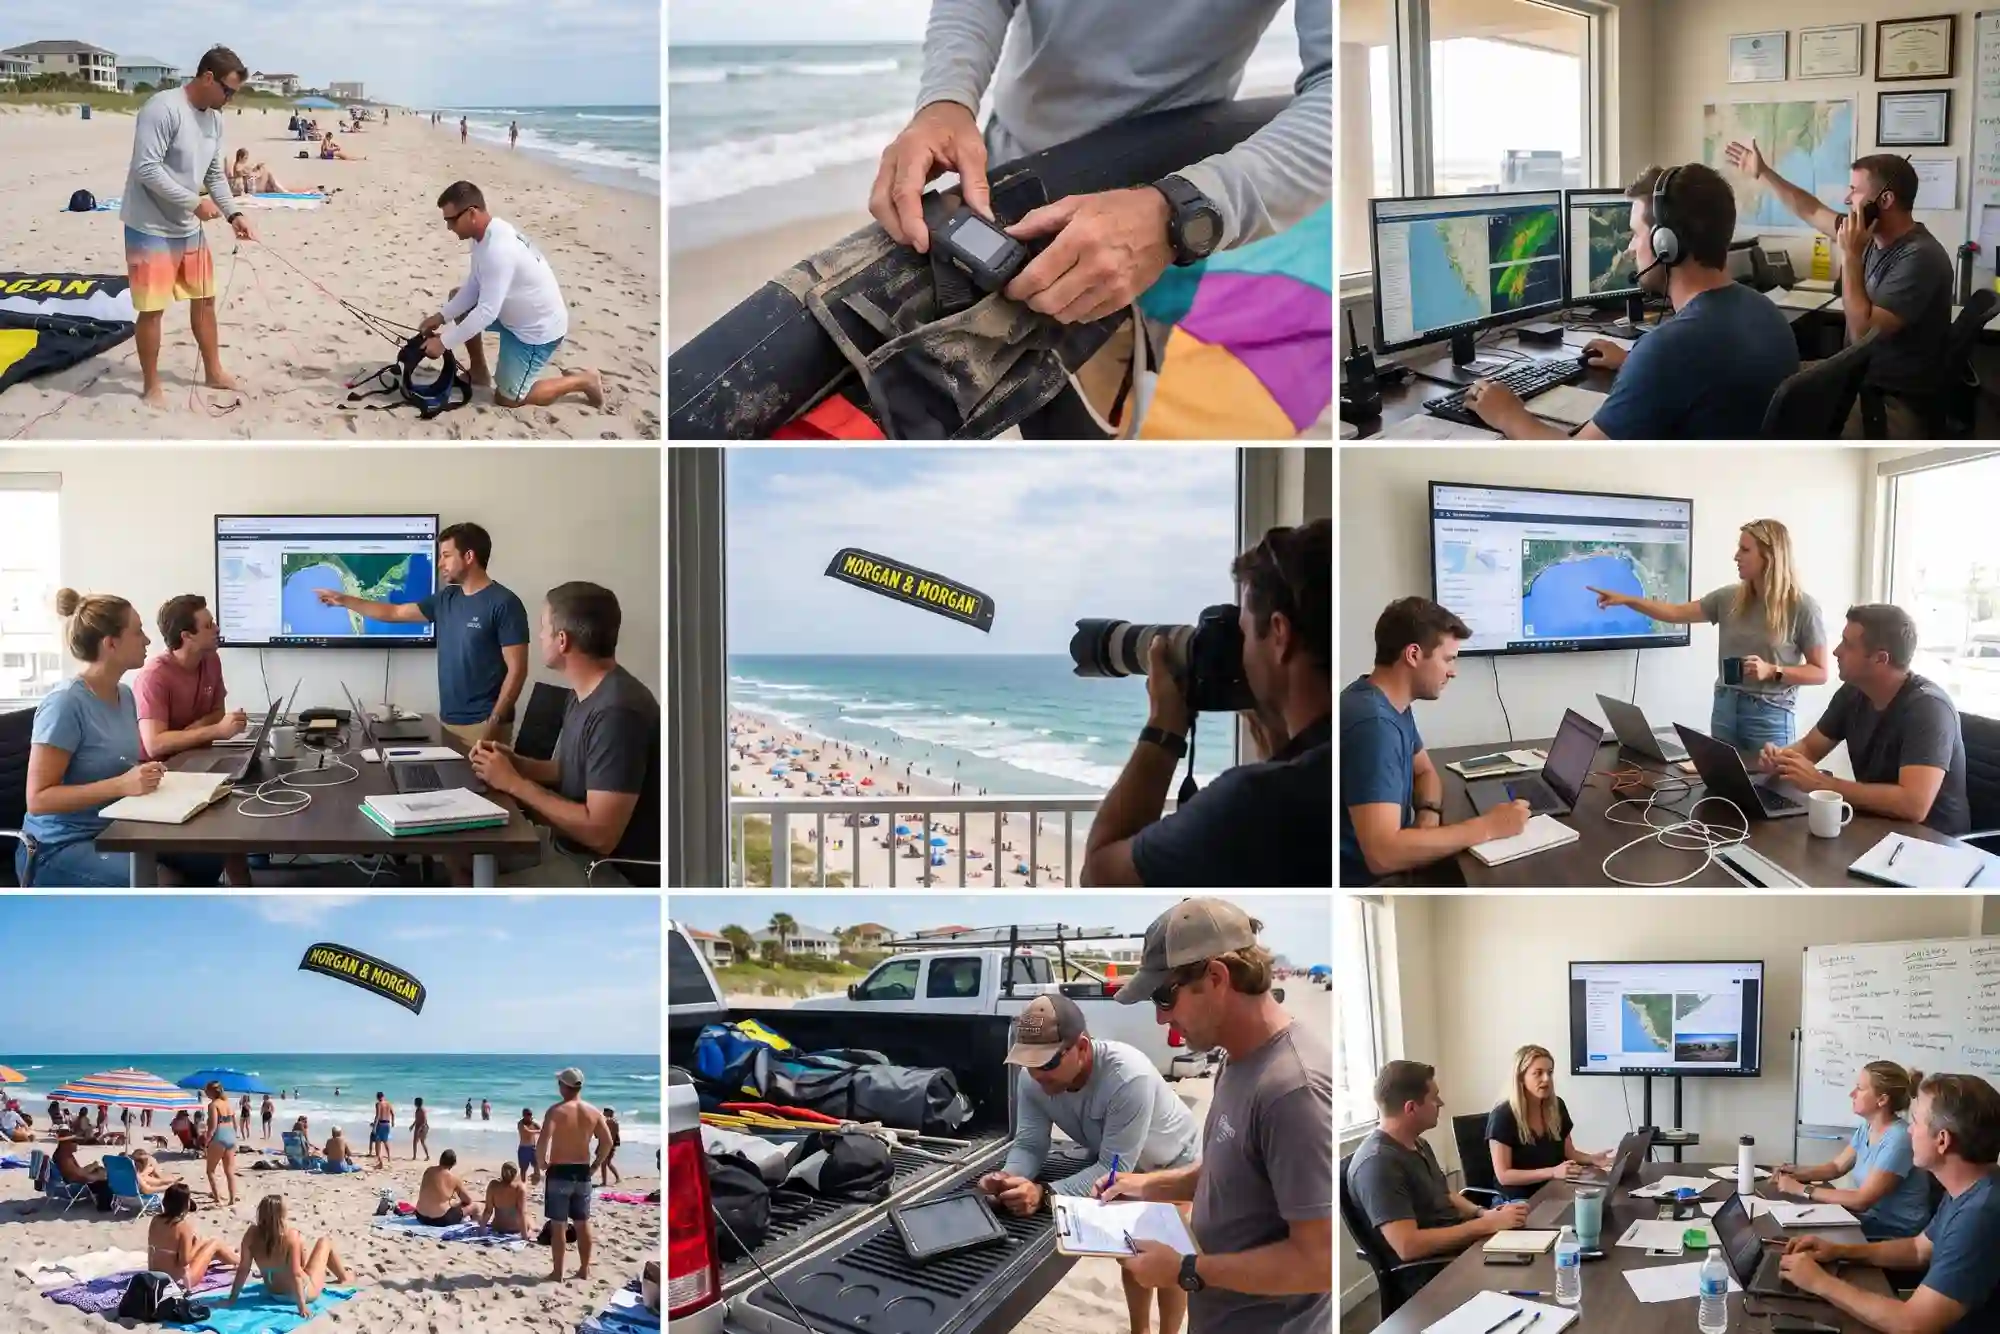
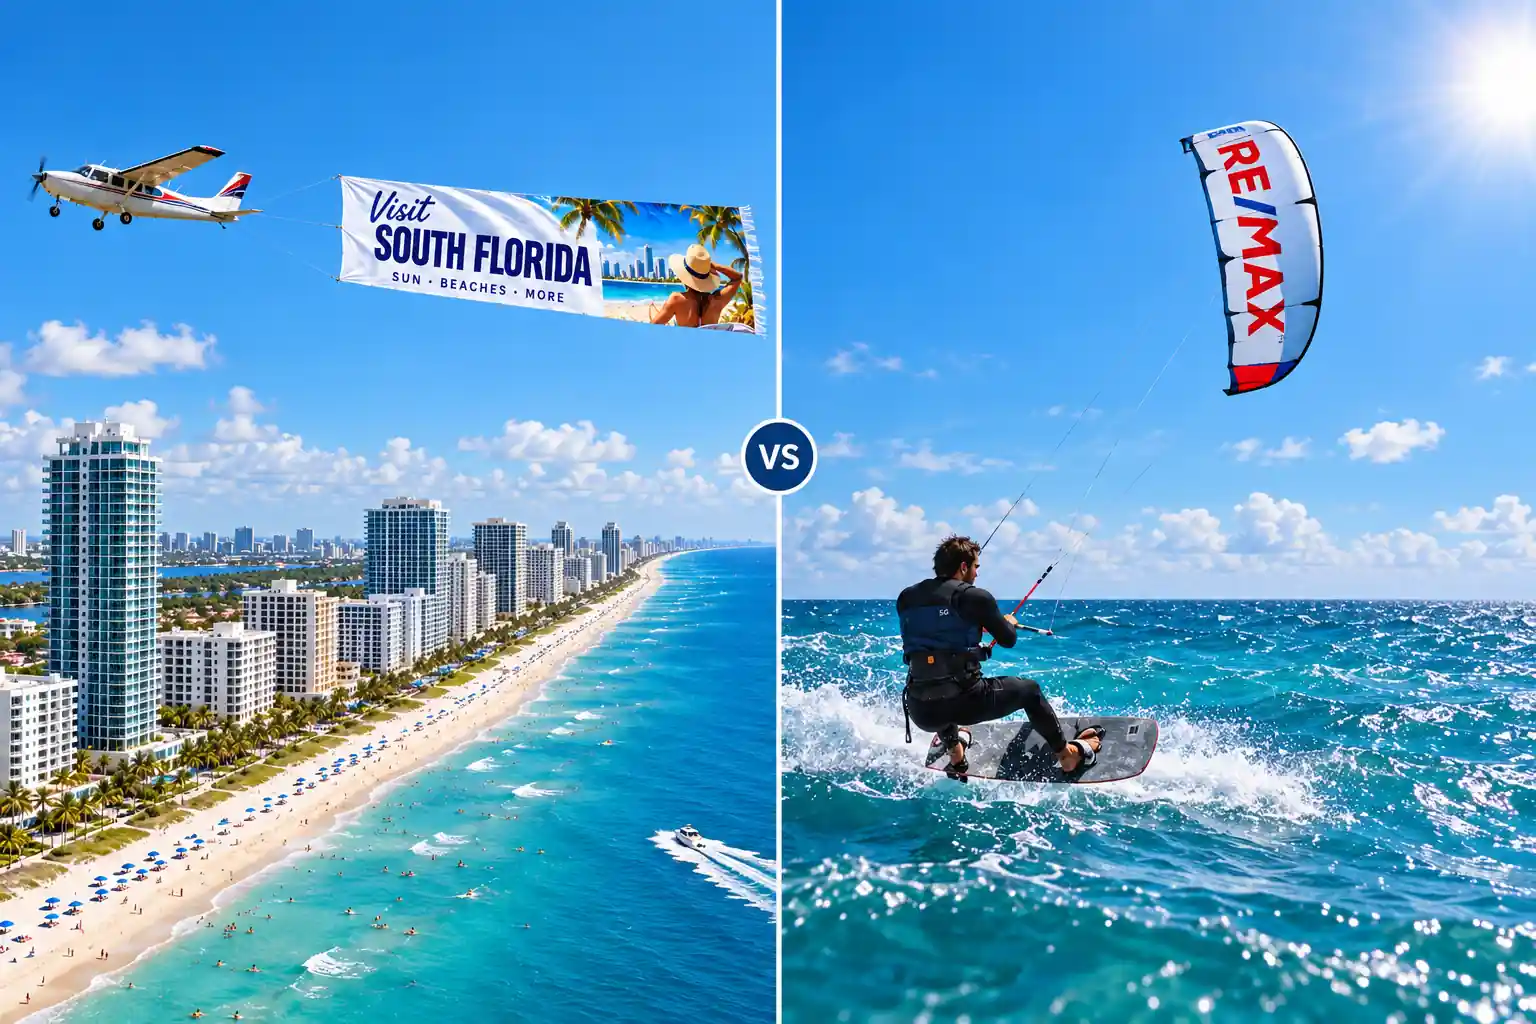




Every media plan eventually reaches a meeting where OOH measurement has to prove its worth. The client asks what the campaign delivered. The agency has to answer with something better than a photo and a good feeling. For billboards, transit, and digital screens, that answer usually comes from established audience data and posting reports. For coastal OOH, the questions are the same but the inputs are different. The audience is on the sand, the media is moving, and the weather has a vote.
OOH measurement for a beach or waterfront campaign has to separate a few things that recap decks often blend together. Did the campaign run as planned? How many people had a realistic opportunity to see it? How often did the same people see it? Did any of that change what they thought or did?
This guide covers each layer for coastal OOH advertising, including kite banner advertising. It explains what GPS verification proves and what it does not. You will also see how to build defensible impression estimates and how reach and frequency work on a beach. Later sections cover tying a campaign to business outcomes and what a planner should expect in the final report.
In This Article:
- Why OOH measurement looks different on the coast
- Proof of performance versus audience delivery
- What GPS flight tracking proves
- Estimating impressions for coastal OOH
- Reach and frequency on the beach
- Setting OOH measurement goals before launch
- Connecting coastal campaigns to business outcomes
- How weather affects campaign reporting
- What a coastal campaign report should include
Why OOH measurement looks different on the coast
Traditional out of home advertising has a measurement backbone built over decades. In the United States, Geopath produces audience estimates for OOH inventory by modeling how many pedestrians and vehicles pass a unit and how likely they are to see it. A planner can pull ratings for a roadside bulletin or a transit shelter and compare them on a common basis.
That system is also changing. In March 2026, Geopath and the Out of Home Advertising Association of America said Ipsos would support a measurement pilot. The pilot is for a next generation measurement platform and starts in the second half of 2026. It will test updated methods for estimating impressions, reach, and frequency across formats (Billboard Insider). The direction is clear. Buyers want OOH accountability that looks more like what they get from other channels.
Why coastal media sits outside standard ratings
Coastal media sits outside most of that standardized inventory. A kite banner over Miami Beach or a waterfront activation along the Jersey Shore does not have a fixed structure, a fixed facing, or a syndicated rating. Geopath’s own documentation notes that moving OOH media has no widely accepted third party audience standard. That gap can slow the sales process with larger brands. That is an honest starting point, and it shapes how coastal OOH measurement should work.
Three conditions make the coast different:
- The audience is stationary for long stretches. Beachgoers often stay for hours, which changes how exposure accumulates compared with drivers passing a billboard in seconds.
- The media moves. A flight path along a shoreline covers different sections of beach at different times, so location and timing records matter more than they do for a static board.
- Delivery depends on conditions. Wind, rain, and local regulations determine when a coastal activation can run, which means the delivered schedule can differ from the planned one.
You can still measure coastal advertising. The plan just has to fit the format instead of borrowing from a rate card.
Proof of performance versus audience delivery
The most common mistake in OOH reporting is treating proof that a campaign ran as proof that it reached people. Those are separate questions with separate evidence, and a good report keeps them in separate columns.
The four kinds of campaign data
For any coastal OOH campaign, it helps to sort every number in the recap into one of four buckets before it goes to a client.
Verified execution data
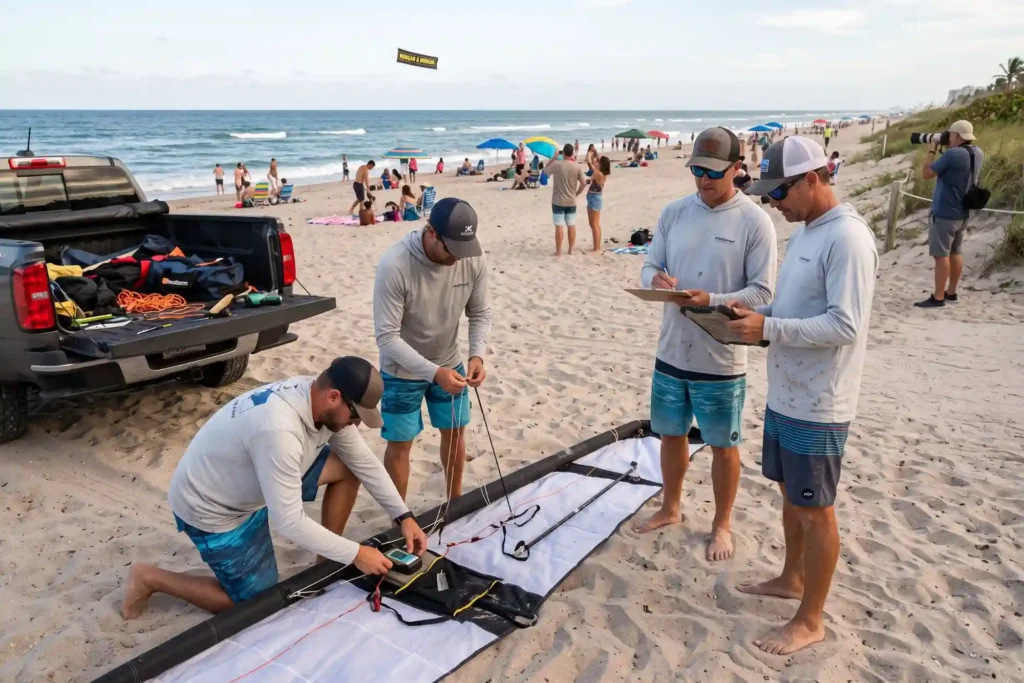
This is what the media owner can document directly: dates, times, locations, flight duration, GPS tracks, and timestamped photo or video of the creative in the air. It answers “did it happen as contracted.” It is the strongest data in the report because it comes from observation, not modeling.
Estimated audience opportunity
These are modeled figures, such as estimated impressions or estimated reach. Planners build them from attendance data, visibility assumptions, and dwell time. They help with planning and comparison, but they are still estimates, so label them that way every time they appear.
Third party market data
Tourism visitation figures, beach attendance counts published by local agencies, and audience research from outside organizations fall here. They give context about a market. They do not describe what a specific campaign delivered.
Measured campaign outcomes
Brand lift studies, search lift, redemption codes, site traffic from the campaign geography, and sales data belong here. These require a study design set up before launch, and they are the only bucket that speaks to whether the campaign changed behavior.
A planner who presents attendance as delivered impressions will eventually get a hard question from the client’s analytics team. Keeping the buckets distinct makes the coastal line item easier to defend at renewal.
What GPS flight tracking proves
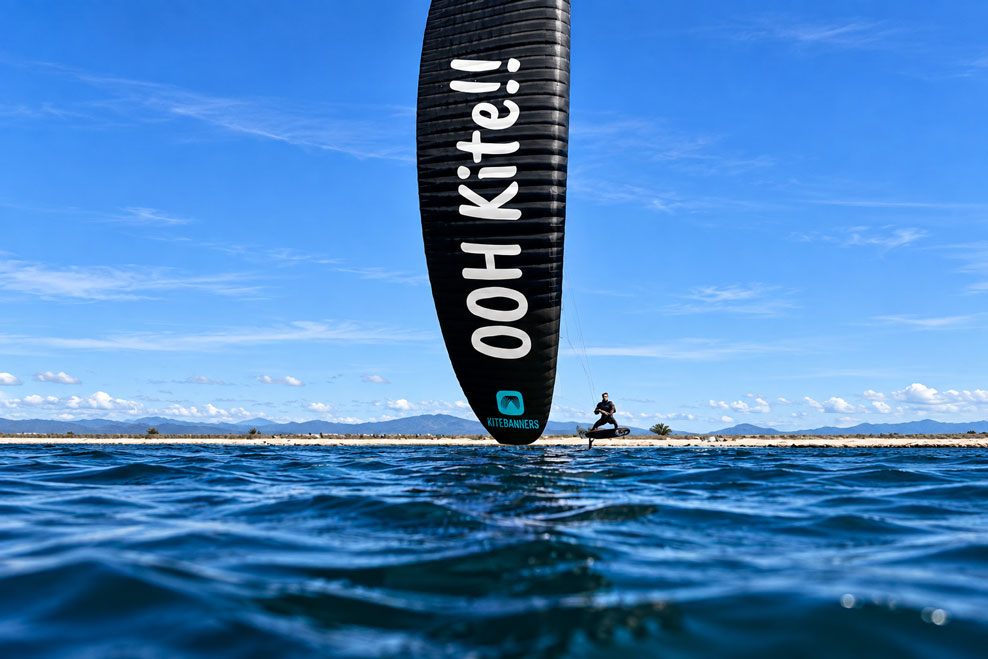
GPS tracking produces a log of where the kite was and when. Paired with timestamped photography and video, it gives an advertiser a verifiable record that the creative flew over the agreed stretch of coastline, on the agreed dates, for a documented amount of time. For an agency, that answers the same question a posting report answers for a billboard: the media ran where and when it was supposed to run.
What a GPS log can confirm
- The activation took place on specific dates and at specific times
- The flight covered the planned beach or waterfront zones
- Total time aloft, by day and by location
- Any deviation from the plan, such as a shortened session or a shifted location
What a GPS log cannot confirm
A GPS track says nothing about who looked up. It does not measure attention, impressions, brand recall, conversions, or sales. Any vendor who presents flight tracking as an attention metric is overstating the data, and a sharp media director will catch it.
GPS data is the foundation the other layers sit on. Once you know exactly where and when the creative flew, you can match that record against attendance data to estimate audience opportunity, or against a geographic test design to measure lift.
Estimating impressions for coastal OOH
In OOH, an impression is generally an estimate of the opportunity to see an ad, adjusted for how likely a person in that location is to notice it. The same logic applies on the coast, with different inputs.
The inputs that matter
A defensible coastal impression estimate usually starts with three pieces of information:
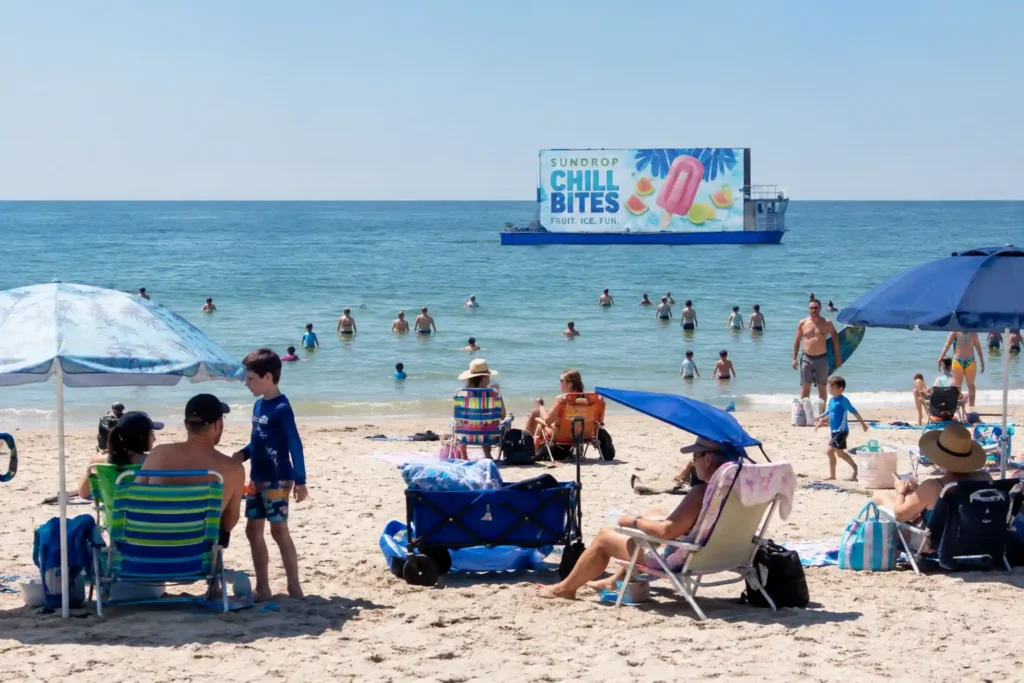
- Audience present. How many people were on the beach or waterfront during the flight window. Some lifeguard agencies and municipalities publish attendance estimates, and the United States Lifesaving Association collects attendance figures from member agencies. These sources vary in method, so cite them by name.
- Visibility zone. The area from which the creative is realistically legible, based on the size of the display, its altitude, and sight lines along the shore.
- Time overlap. How long the creative was aloft over each zone, taken directly from the GPS log, compared against when crowds were present.
Multiply audience present by the share within the visibility zone during flight time, then apply a visibility adjustment for the likelihood of noticing, and you have an estimate. The adjustment is where judgment comes in, and it is the part an agency should ask about directly.
Where estimates go wrong
The biggest risk is borrowing a peak attendance number, such as a holiday weekend count, and applying it to every flight day. A Tuesday in late September in Wildwood is a different audience than Memorial Day weekend. Estimates should use attendance figures that match the actual days, times, and season of the campaign, or clearly state the assumption when matched data is not available.
A second risk is counting the same stationary person many times. A beachgoer who stays from 10 a.m. to 4 p.m. under a flight path may see the creative repeatedly. That frequency is useful, but do not report it as hundreds of separate people. This is where impressions and reach have to be separated.
KiteBanners does not publish standardized impression figures, because the right number depends on the market, dates, and flight plan. When an estimate appears in a proposal, state its method and sources.
Reach and frequency on the beach
Reach is how many different people had the opportunity to see the campaign. Frequency is how many times, on average, each of them had that opportunity. Impressions are roughly reach multiplied by frequency. On a highway, frequency builds slowly through repeat commutes. On a beach, it can build within a single afternoon.
Why dwell time changes the math
Beach audiences tend to stay put. Someone settled near the water for several hours, with a clear view of the sky, is exposed differently than a driver passing a bulletin. That makes coastal OOH a strong frequency medium within a single visit, and it changes how planners should think about campaign scheduling.
If the objective is broad awareness across a market, spreading flights across several beaches and several days builds reach. If the objective is message retention with a specific audience, such as spring break crowds or a weekend event audience, concentrating flights over one high traffic beach during peak hours builds frequency among the people already there.
Planning for reach versus frequency
- Multiple locations across a region, such as Fort Lauderdale, Delray Beach, and Boca Raton on alternating days, favor reach.
- Repeated sessions over one beach on consecutive days favor frequency among locals and repeat visitors.
- Event dates, such as Art Basel Miami Beach week or a summer holiday weekend on the Jersey Shore, compress a large, concentrated audience into a short window.
How coastal reach fits the wider plan
Coastal OOH rarely runs alone, so do not measure it as if it did. A hospitality brand might pair a beach activation with airport displays and roadside boards along A1A. The coastal layer adds reach among people the roadside inventory may miss, plus frequency among visitors who already saw the brand in transit. Reporting should show how the coastal audience overlaps with and extends the rest of the plan.
Setting OOH measurement goals before launch
Most measurement problems are planning problems that show up late. If nobody defined success before the first flight, the recap becomes a pile of photos and estimates no one can evaluate.
Start with the campaign objective
Different objectives call for different evidence. A brand awareness campaign for a suncare line might be judged on brand lift among beachgoers in the target markets. A hotel promoting a waterfront property might care about site visits and bookings from the surrounding area. A beverage brand sampling at a beach event might track redemptions. Pick the outcome first, then choose the measurement that can actually detect it.
Questions to settle in the planning stage
- What is the primary KPI, and which of the four data buckets does it come from?
- Which beaches, dates, and time windows are in the plan, and what attendance sources exist for them?
- Is there a holdout geography or time period that can serve as a comparison?
- Will the creative carry a trackable element, such as a short URL, QR destination on supporting materials, or a promo code?
- How will you handle and report weather related schedule changes?
Measurement scope also affects campaign scope. A brand lift study or a matched market test adds design work and sometimes a research partner. Those decisions belong in the proposal stage, alongside market selection, campaign duration, number of kites, and activation frequency, so the budget reflects what the client actually expects to learn.
Connecting coastal campaigns to business outcomes
Outcome measurement is where OOH has historically been weakest and where buyers are pushing hardest. Coastal campaigns use mostly the same OOH measurement tools as other out of home media.
Brand lift studies
A brand lift study surveys people in the exposed area and compares their awareness, consideration, or intent with a control group that did not have the opportunity to see the campaign. For coastal OOH, that might mean intercept surveys on activated beaches versus comparable beaches without the campaign, or online panels drawn from the campaign geography. The design matters more than the sample size. A weak control group produces lift numbers nobody should trust.
Geographic lift in search and site traffic
If a campaign runs in South Florida but not in a comparable market, branded search volume and site sessions from each area can be compared before, during, and after the flight dates. This works best when the coastal activation is a meaningful share of the brand’s local activity, and when other media in the market is held steady so the comparison stays clean.
Direct response elements
A memorable URL, a promo code tied to the beach campaign, or an offer mentioned on supporting social posts gives a direct, if partial, read on response. Creative on a kite banner has to stay simple to remain legible from the sand, so the response mechanism often lives on companion media, such as sampling teams, social content, or nearby point of sale.
Mobile location studies
Aggregated mobile location panels can compare later store or venue visits from devices seen in the activation area against a control group. Results depend on panel quality and privacy compliant sourcing, and they show association rather than proven causation, so ask for the methodology.
People also tend to photograph kite displays over a beach. Tagged posts and user generated content can be tracked, but report them as earned media, separate from paid OOH delivery.
How weather affects campaign reporting
Any water based media or aerial advertising format runs on the weather’s schedule. Wind speed and direction, storms, and local restrictions can shorten or cancel a session. A planner reviewing OOH measurement for a coastal buy should ask the vendor how they handle that risk before signing. Then ask how it will show up in the report.
What good weather reporting looks like
- A planned schedule and a delivered schedule, side by side, with the difference explained
- Weather notes for each scheduled day, including the conditions that led to any change
- Makeup sessions identified as makeup sessions, with their own dates, times, and GPS records
- Audience estimates recalculated for the actual delivered windows, not the original plan
Teams often miss that last point. If a Saturday session moves to the following Wednesday, reporting the Saturday estimate overstates delivery.
Seasonality by market
Weather patterns also shape when markets make sense. South Florida supports activations through the winter, when northern beaches are quiet. The Jersey Shore concentrates its audience between Memorial Day and Labor Day. California coastal markets have their own wind and fog patterns. Building the flight plan around each market’s season protects both delivery and the credibility of the numbers.
KiteBanners monitors conditions as part of campaign execution, and professional operators decide whether a session can run safely. The report then documents exactly what happened.
What a coastal campaign report should include
Whether you are buying coastal OOH for the first time or comparing vendors, use this checklist for the final report.
Execution and proof of performance
- Flight log by date, start time, end time, and location
- GPS track maps for each session
- Timestamped photography and video of the creative in flight
- Planned versus delivered schedule, with weather notes
Audience estimates
- Estimated impressions, reach, and frequency, clearly labeled as estimates
- Named sources for attendance or visitation data
- The visibility and dwell time assumptions used in the model
- Estimates tied to delivered flight windows, not the original plan
Outcomes, when a study was designed
- Brand lift results with the control design described
- Search, site, or redemption data from the campaign geography
- Earned social activity reported separately from paid delivery
KiteBanners has run campaigns for brands including RE/MAX. The documentation from those activations follows the same logic. Show clearly what ran. Label estimates as estimates. Keep the evidence organized so an agency can drop it straight into a client recap.
OOH measurement for coastal campaigns rests on a simple discipline. Verified execution data, such as GPS flight logs and timestamped imagery, proves the campaign ran where and when it should. Impression, reach, and frequency figures estimate the audience opportunity and need named sources and stated assumptions. Outcome studies, planned before launch, are what connect a beach activation to awareness, traffic, or sales.
Coastal OOH advertising works best as an added layer in an integrated media plan, reaching people in places where roadside and transit inventory may not, during hours when they are relaxed and looking around. Measured honestly, it can hold its own in a recap meeting alongside every other line item in the plan.
If you are planning a campaign for South Florida, the Jersey Shore, or a California coastal market and want to see how measurement would work for your objectives, talk with KiteBanners about your market and campaign dates. We can walk through flight planning, documentation, and the OOH measurement options that fit your goals. Then we can put together a campaign recommendation your client can evaluate.